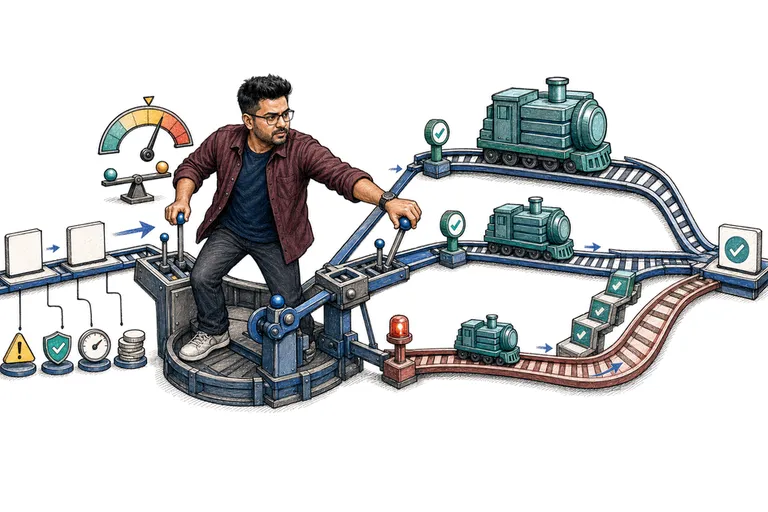
Observability for LLM and Agent Systems
Trace a user outcome, not isolated calls
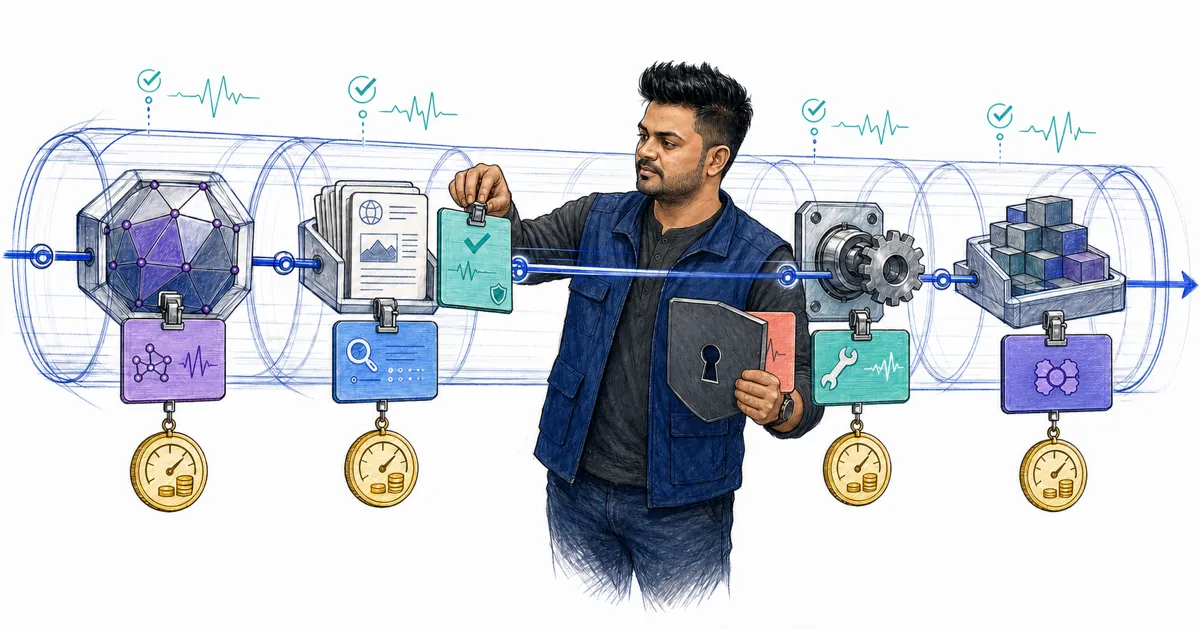
One product request can trigger several model invocations, retrieval queries, rerankers, tool calls, approvals, and retries. Give the logical run a stable trace identifier and represent each operation as a span with parent relationships. Include queued time separately from execution. A model latency chart alone cannot explain why a user waited thirty seconds when the real delay was a saturated tool queue or repeated validation failure.
Record configuration identifiers rather than copying huge prompts into every event: model, prompt template, policy, index, adapter, router, and tool schema versions. Capture token counts, cache usage, finish reason, structured validation, retry class, and selected route. For retrieval, record query plan, filters, candidate IDs, scores, and final evidence IDs. This enables diagnosis while keeping payload storage controlled.
Agent traces need state transitions: objective, proposed action, validation decision, activity result, remaining budget, and terminal reason. Store the model’s explicit structured output, not private chain-of-thought. Observability should answer what the system saw and did without requiring hidden reasoning. Link external receipts and workflow histories so operators can reconcile actual effects.
Design privacy before collecting payloads
Prompts and tool results can contain personal data, credentials, source code, contracts, and medical information. Default to structured metadata and content hashes, then sample payloads only under a defined purpose, retention period, encryption policy, and access role. Redact before export to third-party telemetry. Post-hoc deletion from many observability vendors is slower and less reliable than not collecting unnecessary content.
Redaction is context-sensitive. A numeric string may be a harmless product ID or sensitive account number. Prefer field-aware controls at structured boundaries and tenant-configurable policies. Secrets should be removed before the model and before logs. For debugging rare failures, use an audited break-glass path to encrypted payloads rather than granting broad search access to every engineer.
Respect data residency and deletion across traces, evaluation exports, alert samples, and backups. Keep a lineage map from user request to derived telemetry so privacy operations can find copies. Anonymized aggregates are useful for long-term trends, while raw samples can expire quickly. Security teams should threat-model the observability platform because it often becomes the richest consolidated store in the AI system.
Measure service, quality, and economics together
Service metrics include time to first token, inter-token latency, end-to-end latency, queue delay, error rate, tool duration, and workflow completion. Segment them by model, route, tenant class, context length, and operation type. Token throughput without queue context can reward overload. Define service objectives at the user-facing outcome and track error-budget burn so teams know when reliability work should take priority.
Quality metrics can include schema validity, citation support, retrieval coverage, tool correctness, verifier outcomes, user correction, and escalation. Most are delayed or sampled, so join them back to traces when labels arrive. Avoid using thumbs-up alone; response bias and product placement distort it. A small reviewed sample with stable rubrics can be more informative than millions of ambiguous implicit events.
Cost spans should report provider charge or allocated compute, storage, and tool expense. Aggregate to cost per successful outcome alongside latency and quality. This reveals routes that are fast but wrong, cheap but escalated, or accurate but unsustainable. Operational decisions become multi-objective rather than optimizing whichever dashboard is most visible.
Turn signals into incident response
Alerts should detect user harm or imminent saturation, not every fluctuation. Useful signals include sustained latency objective burn, tool failure spikes, invalid output surges, route distribution change, retrieval survivor collapse, permission denials, runaway step counts, and unusual cost. Dynamic baselines can catch shifts, while hard thresholds protect known limits. Every alert needs an owner, runbook, and link to representative traces.
Deploy annotations let operators correlate changes in prompts, models, indexes, policies, and dependencies with behavior. Canary dashboards compare cohorts rather than blending them. Preserve rollback controls for configuration as well as code. Many AI incidents come from an edited prompt or corpus migration that ordinary deployment tooling does not see, so configuration must participate in release observability.
After an incident, convert the failure into a detector, evaluation case, or invariant. Review whether telemetry enabled fast localization without exposing excess data. Track mean time to detect, understand, mitigate, and verify recovery. Mature observability shortens the path from a user-visible anomaly to the exact model, evidence, tool, and state transition responsible.
Research foundation and scope
W3C Trace Context defines interoperable trace propagation, and OpenTelemetry semantic conventions provide shared vocabulary for model operations [W3C-TRACE] [OTEL-GENAI]. AI systems need those service signals joined with evidence, policy, cost, and product outcomes. These sources establish the mechanism, but they do not remove the need to measure the local implementation. A paper's result belongs to its checkpoint, dataset, hardware, traffic, and experimental protocol; a standard describes a contract or risk practice, not a guarantee that a particular product follows it. The useful engineering move is to convert each cited idea into a hypothesis that can be falsified with representative inputs and observable intermediate state.
Full prompts and tool results can contain credentials, personal data, customer documents, and injected content. Observability must remain useful when raw payload capture is minimized, redacted, encrypted, sampled, or disabled. Write these conditions into the design review before selecting a library or provider. Specify the authoritative source of truth, the authenticated principal, the versions that influence behavior, the maximum consequence of an error, and what the system will do when required evidence is missing. This boundary statement makes later optimization honest: teams can compare speed, cost, or convenience only after candidates satisfy the same correctness, authorization, privacy, and recovery contract.
Read [W3C-TRACE], [OTEL-GENAI], [NIST-GAI] together rather than treating one source as a recipe. Trace Context Level 2 supplies one part of the foundation; OpenTelemetry Generative AI semantic conventions supplies a second perspective; Artificial Intelligence Risk Management Framework: Generative Artificial Intelligence Profile helps connect the mechanism to evaluation, governance, or operations. The citations are deliberately primary papers, standards, or official documentation. Product-specific claims still require local evidence, and any dated behavior must be rechecked against the cited version before an article or architecture decision is refreshed.
A production implementation blueprint
Propagate run and trace IDs through gateway, retrieval, model, tools, queues, and UI. Record structured versions, token counts, latencies, decisions, errors, and receipts; store sensitive content separately under purpose-based access and retention. Begin with one thin vertical path that preserves all decision evidence. Give each run a stable identifier; capture normalized input, authenticated scope, relevant dependency versions, selected policy, timing, result status, and any external receipt. Keep large or sensitive payloads in a separately governed store and pass bounded references through the orchestration layer. This produces a debuggable system without making raw customer content the default telemetry substrate.
Make state transitions explicit and make every external boundary return a typed result. Distinguish validation failure, permission denial, missing evidence, rate limit, timeout, dependency outage, user cancellation, and internal defect. The distinction matters because each permits a different response: clarify, retry, fall back, defer, compensate, or stop. A generic exception handler that asks the model to try again turns uncertainty into repeated cost and can duplicate irreversible effects. Retries require an idempotency strategy and a stored receipt, not optimism.
Roll out the implementation as a versioned policy. Record which cohort receives it, what baseline it replaces, which metrics can stop the rollout, and how to reverse stateful artifacts such as indexes, caches, adapters, or workflow histories. Review privacy and retention alongside performance. If raw content is needed temporarily for diagnosis, state the purpose, access, sampling, encryption, and deletion window. Production readiness means the team can explain, contain, and reverse behavior under load—not merely demonstrate the happy path once.
Failure lab and evaluation plan
Trace known successful and failed journeys, compare sampled versus metadata-only diagnosis, inject slow tools and retries, and verify context across async queues. Test that redaction cannot be bypassed through nested multimodal or tool payloads. Keep the arrival pattern, data distribution, authorization, and dependency versions close to production. Use a paired baseline where possible and retain per-case results so averages cannot hide a severe slice. Offline evaluation should localize the failing stage; shadow evaluation should expose integration and traffic effects; a canary should confirm user-facing outcomes with a small blast radius. Each stage needs an exit criterion rather than a vague request to 'look good.'
Exercise broken trace propagation, high-cardinality labels, secret leakage, missing token usage, clock skew, duplicate spans after retry, provider outage, unbounded payload logs, and dashboards that average away one tenant's incident. Add adversarial boundary cases and partial failures, not only malformed inputs. Terminate a worker after an external system may have committed, revoke access after a cache was populated, change one dependency version, and delay one branch until its data is stale. Confirm that cancellation releases resources and that a fallback preserves semantics. The test passes only when the external outcome, audit evidence, and user-visible state agree; a fluent final message is not proof of completion.
Evaluation data needs lineage equal to production data. Record why each case exists, who reviewed the expected behavior, which source or policy supports it, and when it must be refreshed. Separate generated cases from production incidents and prevent test cases from leaking into training. When a metric changes, inspect changed examples before accepting an aggregate. A statistically small regression can still block release if it crosses an authorization, privacy, safety, or irreversible-action boundary.
Operating metrics and decision record
Track trace completeness, time to isolate failures, service latency and errors, quality and policy outcomes, cost per run, payload capture rate, redaction misses, cardinality, sampling bias, and incident replay coverage. Define every metric with a numerator, denominator, unit, time window, exclusions, and responsible owner. Segment by workload and consequence so a dominant easy class cannot hide a rare costly failure. Pair service signals with product outcomes: latency without completion encourages fast useless answers, while answer quality without queue and cost data can produce an uneconomic service. Review percentiles and distributions rather than relying on a single average.
Design telemetry from the incident questions the team must answer, then collect the minimum structured evidence that supports those answers safely. Put that choice in a short architecture decision record containing context, alternatives, evidence, assumptions, selected policy, rollout, reversal trigger, and unresolved risk. Link the evaluation snapshot and source versions. This document prevents a benchmark from becoming folklore and tells the next engineer which evidence must be repeated when the model, provider, traffic, data, regulation, or product promise changes.
Monitor leading and lagging signals after release. Leading signals reveal pressure—queue age, cache allocation, disagreement, validation failure, policy denial, or retry growth—before users report harm. Lagging signals show whether the job was actually completed and trusted. Alert on a service objective tied to user consequence, and make the run identifier available to support without exposing private content. Every serious miss should become a reproducible regression case and, when relevant, a new threat or data-quality control.
Primary sources and further reading
- Trace Context Level 2World Wide Web Consortium · standard
- OpenTelemetry Generative AI semantic conventionsOpenTelemetry · standard
- Artificial Intelligence Risk Management Framework: Generative Artificial Intelligence ProfileNational Institute of Standards and Technology · standard
Written by

Co-founder & CTO of ViitorCloud · Founder of LaraCopilot · Organizer of Laracon India · Shipping production software since 2005
More about Vishal